
Overview
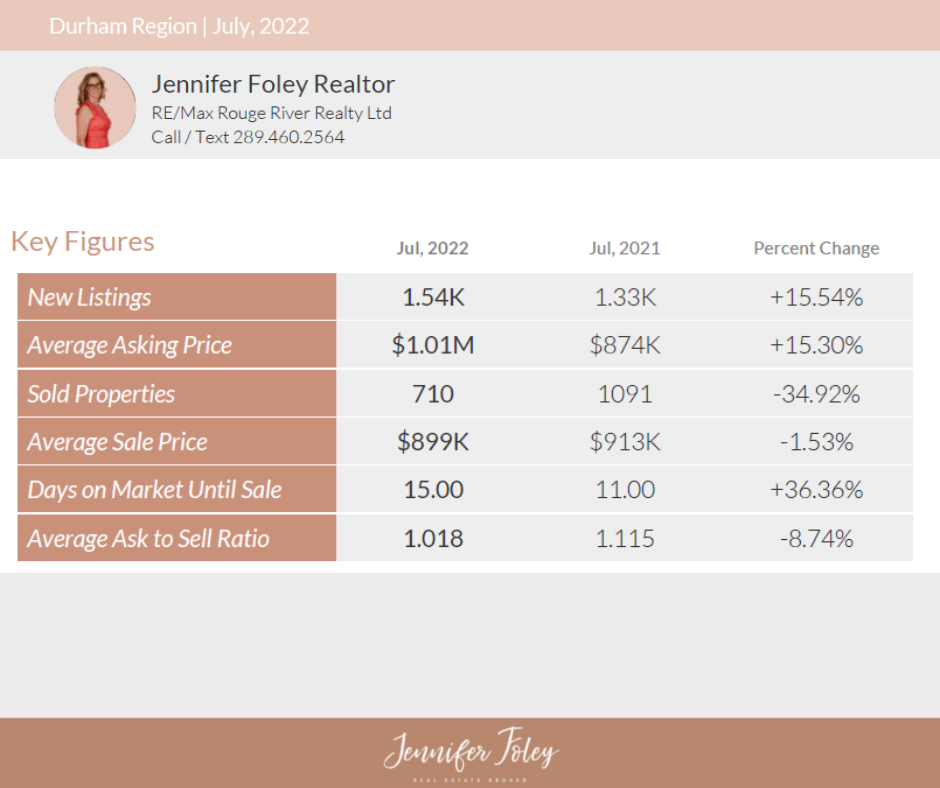
In July, 2022, we have seen 1.54K properties listed which has resulted in a 15.54% increase from July, 2021 in which 1.33K properties were listed;
We have seen a year to date volume of 13.5K in 2022 and 13.6K in 2021 resulting in a 0.26% decrease.
In July, 2022, we have seen a total volume of 710 sold properties which has resulted in a 34.92% decrease from July, 2021 in which 1091 listings were sold;
We have seen a year to date volume of 7100 in 2022 and 10216 in 2021 resulting in a 30.50% decrease.
The average sales price in July, 2022 is $899K, a 1.53% decrease from July, 2021. The average sales price of July, 2021 was $913K.
We have seen a year to date average sales price of $1.08M in 2022 and $903K in 2021 resulting in a 19.49% increase.
The average ask to sell ratio in July, 2022 was 1.018, an 8.74% decrease from July, 2021 with an ask to sell ratio of 1.115.
We have seen a year to date average ask to sell ratio of 1.173 in 2022 and 1.131 in 2021 resulting in a 3.76% increase.
I. New Listings
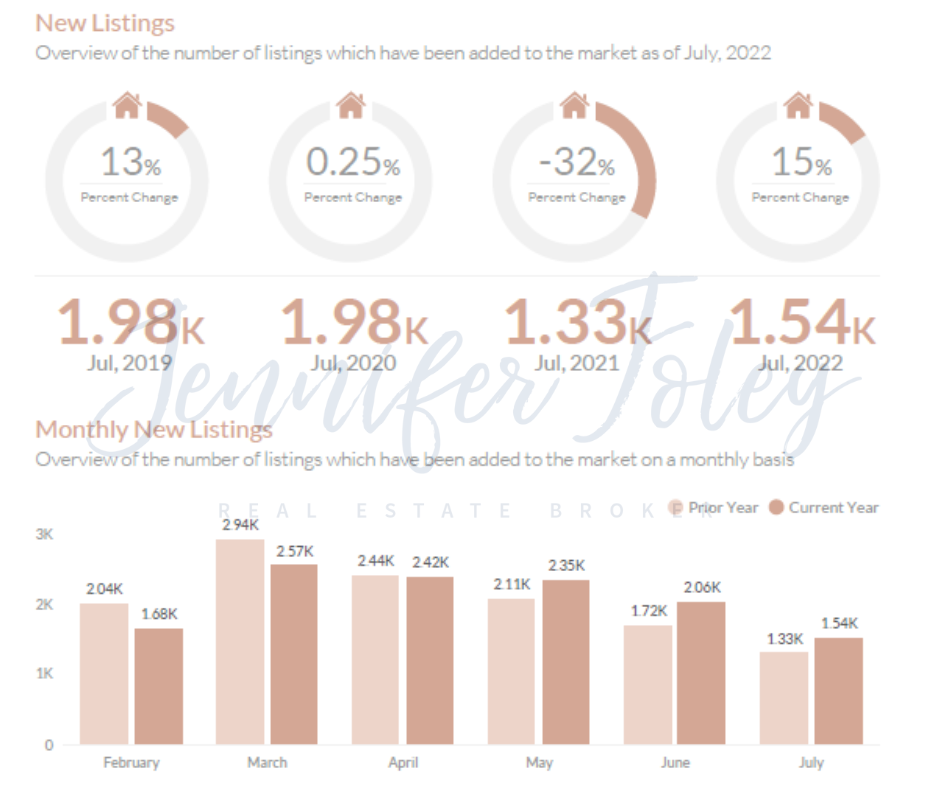
- July 2022 - There were 13.5K new listings, a 0.26% decrease from July, 2021
- July 2021 - There were 13.6K new listings, a 32.30% increase from July, 2020
- July 2020 - There were 1.98K new listings, a 0.25% increase from July, 2019
- July 2019 - There were 1.98K new listings, a 13.70% increase from July, 2018
II. Average Asking Price
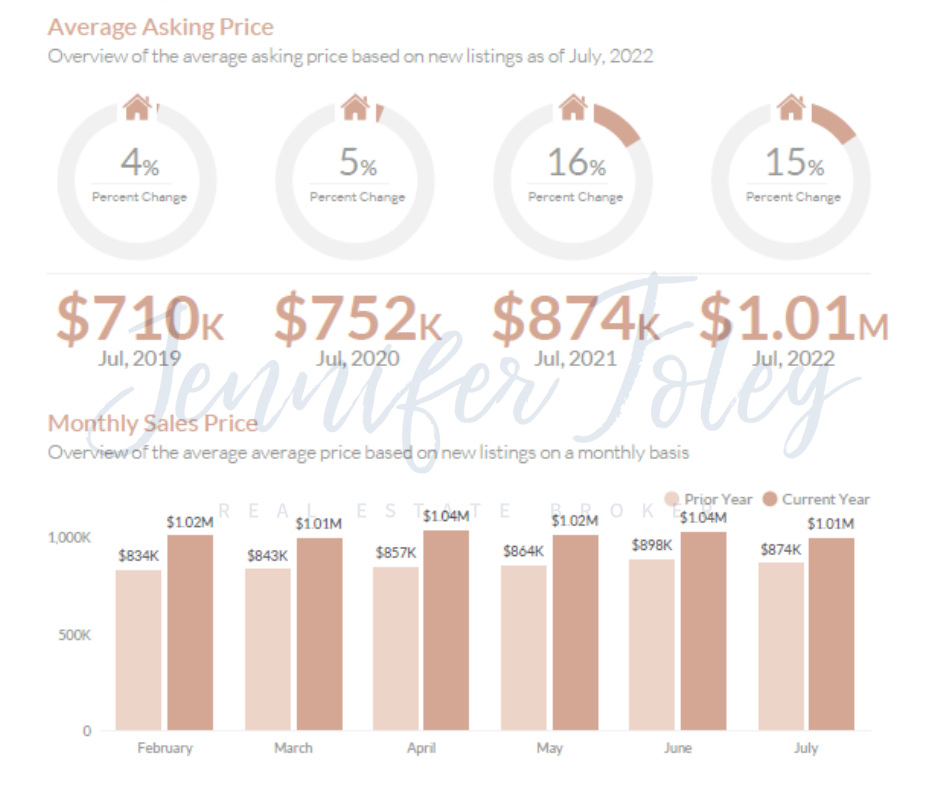
- July 2022 - The average asking price was $1.01M, a 15.30% increase from July, 2021
- July 2021 - The average asking price was $874K, a 16.13% increase from July, 2020
- July 2020 - The average asking price was $752K, a 5.97% increase from July, 2019
- July 2019 - The average asking price was $710K, a 4.57% increase from July, 2018
III. Sold Properties
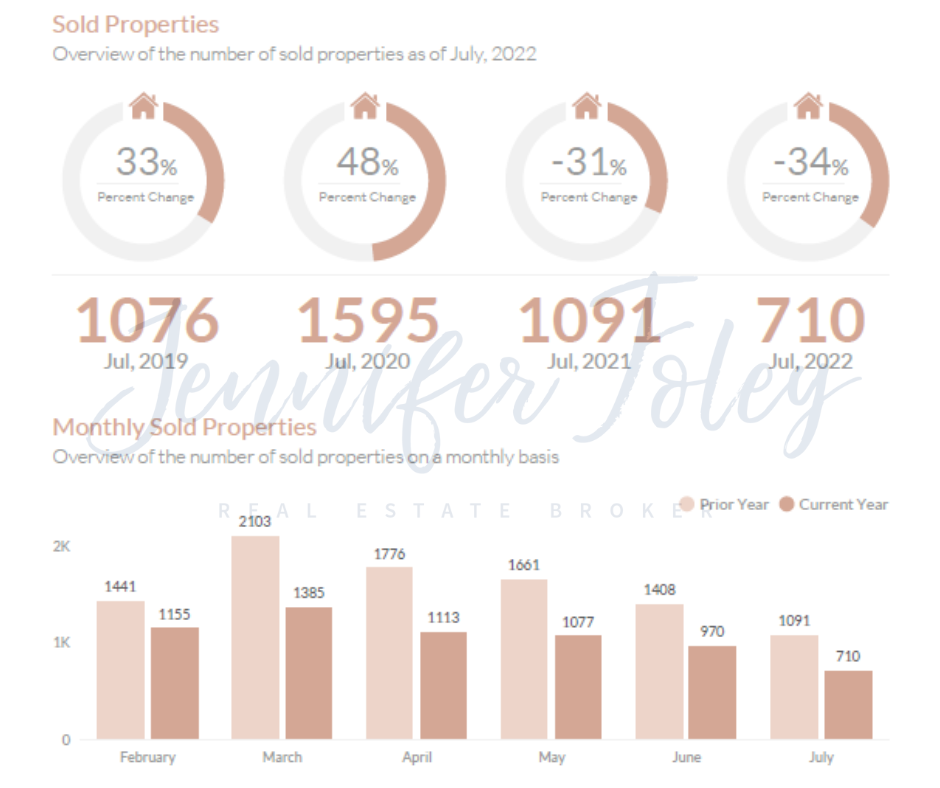
- July 2022 - There were 710 sold properties, a 34.92% decrease from July, 2021
- July 2021 - There were 1091 sold properties, a 31.60% decrease from July, 2020
- July 2020 - There were 1595 sold properties, a 48.23% increase from July, 2019
- July 2019 - There were 1076 sold properties, a 33.83% increase from July, 2018
IV. Average Sale Price
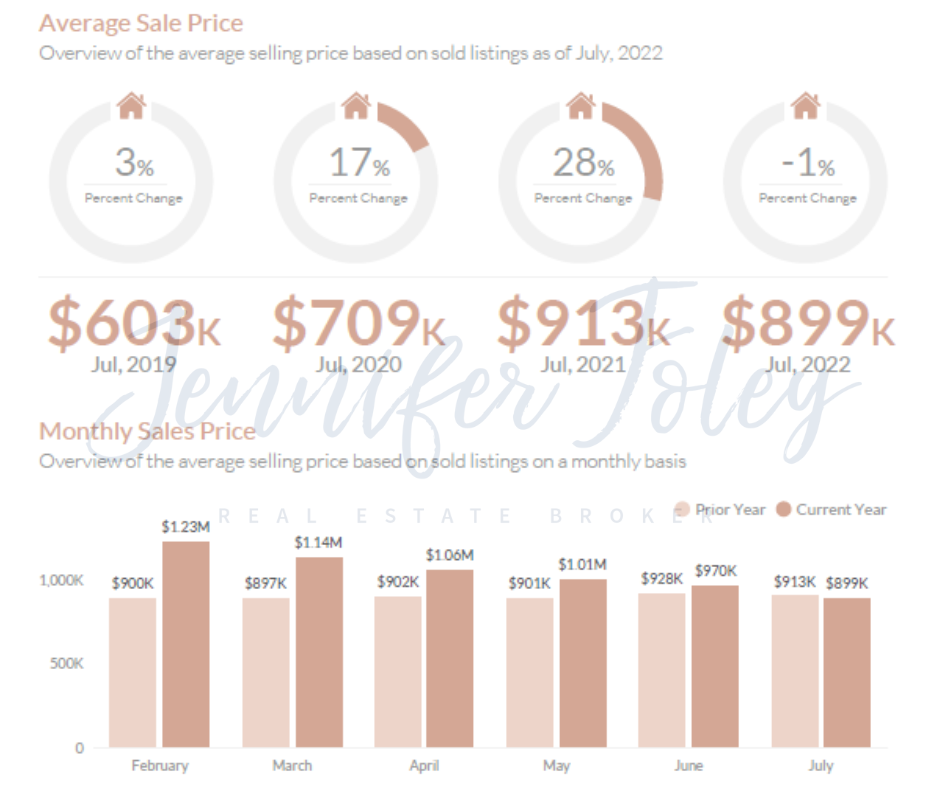
- July 2022 - The average sales price was $899K, a 1.53% decrease from July, 2021
- July 2021 - The average sales price was $913K, a 28.80% increase from July, 2020
- July 2020 - The average sales price was $709K, a 17.60% increase from July, 2019
- July 2019 - The average sales price was $603K, a 3.49% increase from July, 2018
V. Average Days on Market
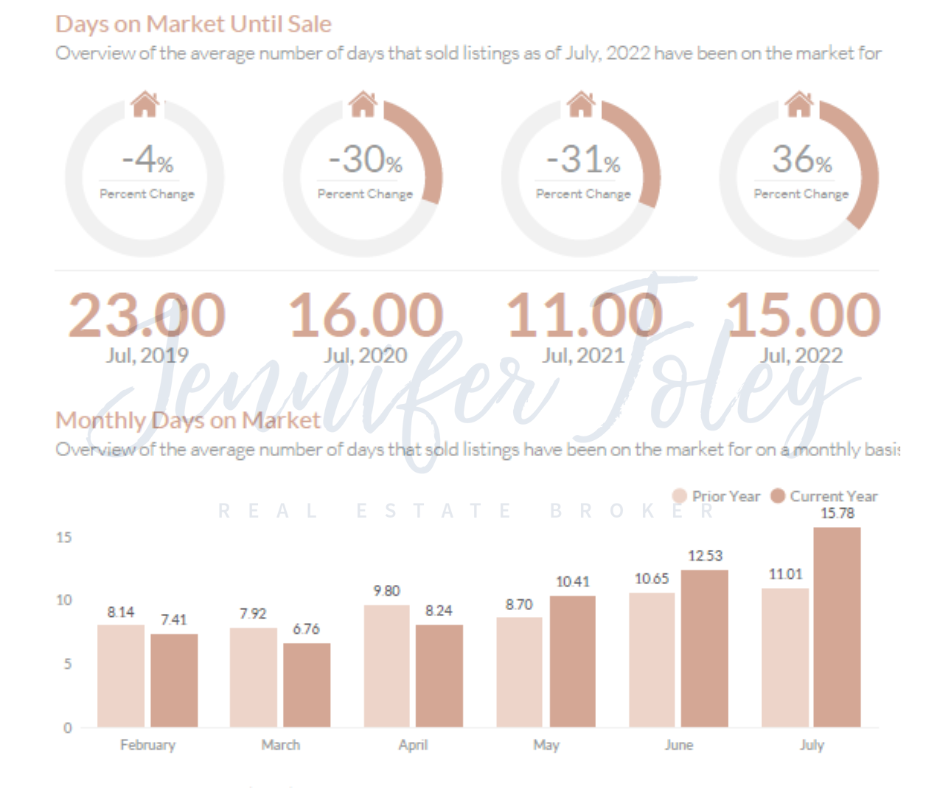
- July 2022 - The average days on market was 15.00, a 36.36% increase from July, 2021
- July 2021 - The average days on market was 11.00, a 31.25% decrease from July, 2020
- July 2020 - The average days on market was 16.00, a 30.43% decrease from July, 2019
- July 2019 - The average days on market was 23.00, a 4.17% decrease from July, 2018
VI. Average Ask to Sell Ratio
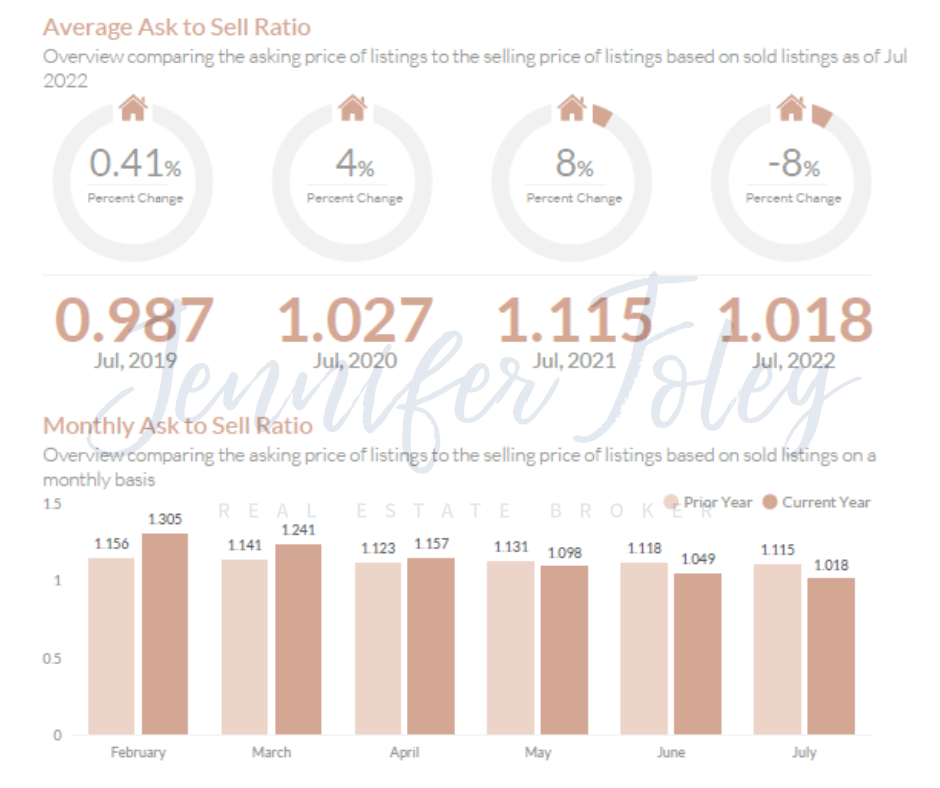
- July 2022 - The average ask to sell ratio was 1.018, an 8.74% decrease from July, 2021
- July 2021 - The average ask to sell ratio was 1.115, an 8.61% increase from July, 2020
- July 2020 - The average ask to sell ratio was 1.027, a 4.03% increase from July, 2019
- July 2019 - The average ask to sell ratio was 0.987, a 0.41% increase from July, 2018
Post a comment