
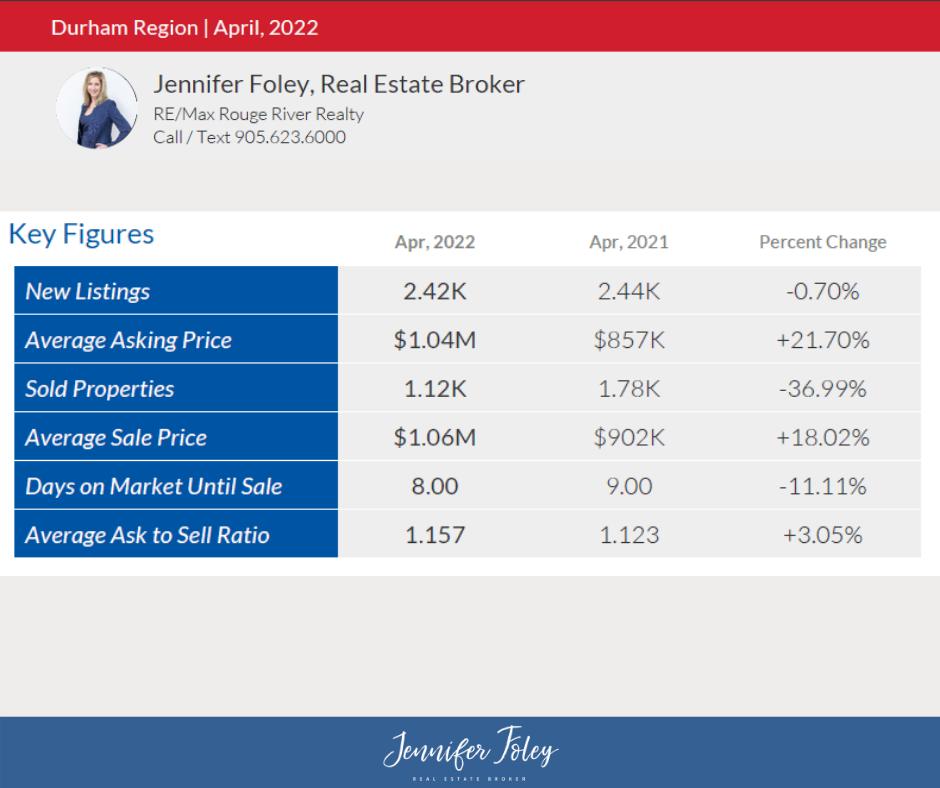
In April 2022, we have seen 2.42K properties listed which has resulted in a 0.70% decrease from April 2021 in which 2.44K properties were listed;
We have seen a year-to-date volume of 7.59K in 2022 and 8.41K in 2021 resulting in a 9.79% decrease.
In April 2022, we have seen a total volume of 1.12K sold properties which has resulted in a 36.99% decrease from April 2021 in which 1.78K listings were sold;
We have seen a year-to-date volume of 4.36K in 2022 and 6.06K in 2021 resulting in a 27.97% decrease.
The average sales price in April 2022 is $1.06M, an 18.02% increase from April 2021. The average sales price of April 2021 was $902K.
We have seen a year-to-date average sales price of $1.15M in 2022 and $896K in 2021 resulting in a 28.36% increase.
The average asks to sell ratio in April 2022 was 1.157, a 3.05% increase from April 2021 with an ask to sell ratio of 1.123.
We have seen a year-to-date average ask to sell ratio of 1.245 in 2022 and 1.136 in 2021 resulting in a 9.57% increase.
I. Monthly New Listing
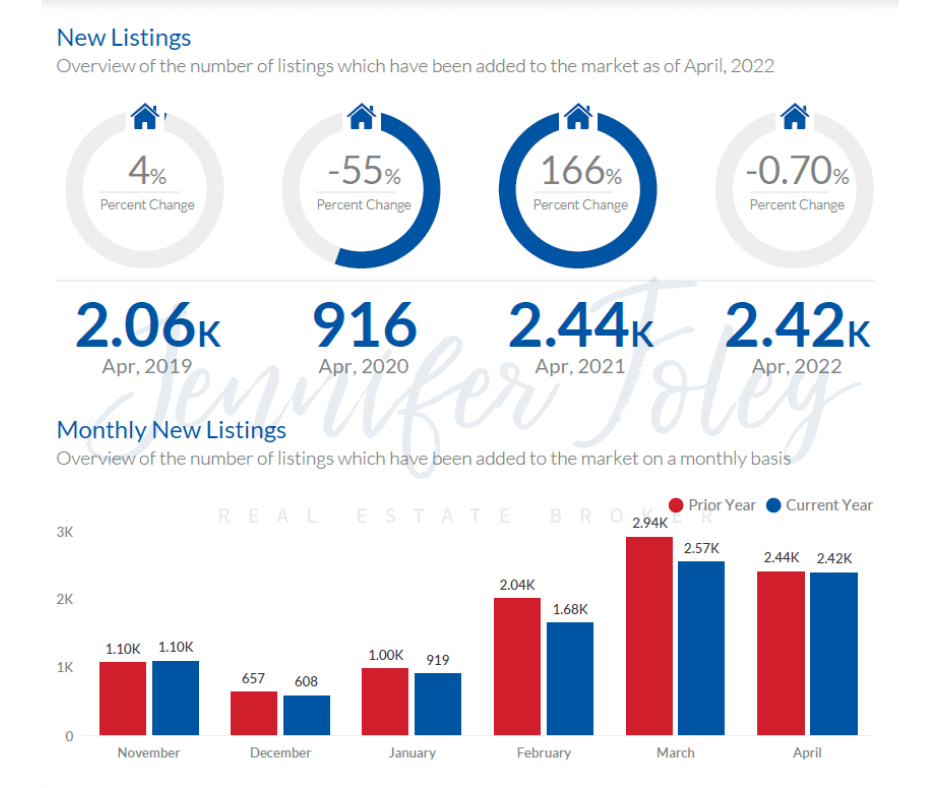
- April - 2022: There were 2.42K new listings, a 0.70% decrease from April 2021
- April - 2021: There were 2.44K new listings, a 166.27% increase from April 2020
- April - 2020: There were 916 new listings, a 55.45% decrease from April 2019
- April - 2019: There were 2.06K new listings, a 4.52% decrease from April 2018
II. Monthly Average Asking Price

- April - 2022: The average asking price was $1.04M, an 21.70% increase from April 2021
- April - 2021: The average asking price was $843K, an 18.83% increase from March 2020
- April - 2020: The average asking price was $710K, a 4.72% increase from March 2019
- April - 2019: The average asking price was $678K, a 2.43% decrease from March 2018
III. Monthly Sold Properties
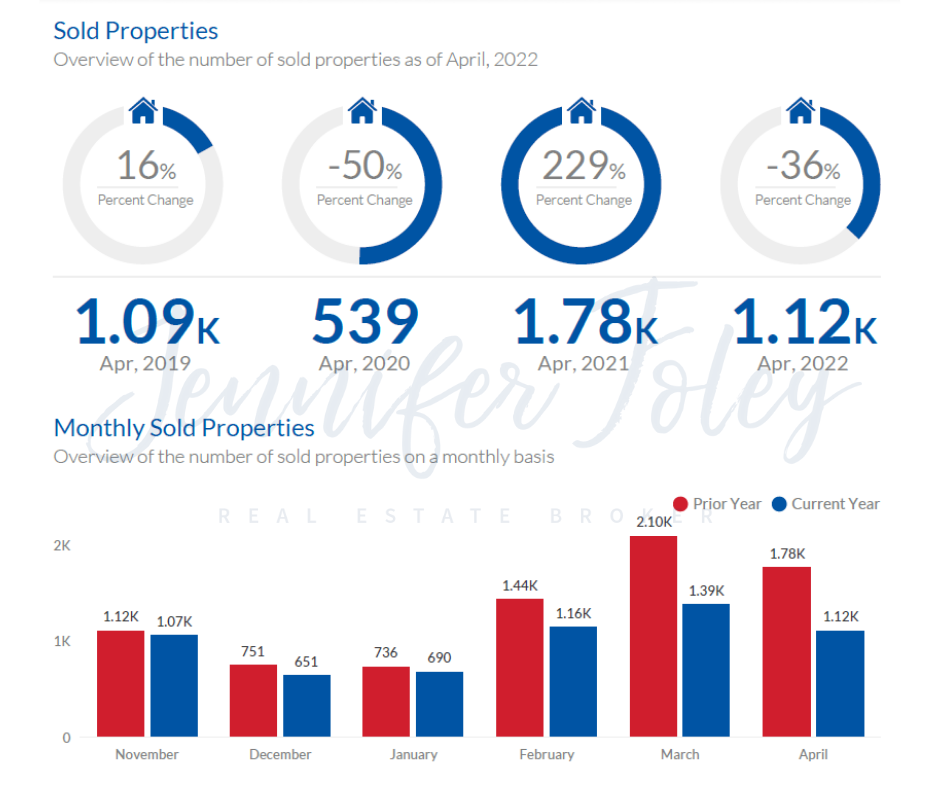
- April 2022: There were 1.12K sold properties, a 36.99% decrease from April 2021
- April 2021: There were 1.78K sold properties, a 229.50% increase from April 2020
- April 2020: There were 539 sold properties, a 50.55% decrease from April 2019
- April 2019: There were 1.09K sold properties, 16.95% increase or decrease from April 2018
IV. Monthly Average Sale Price
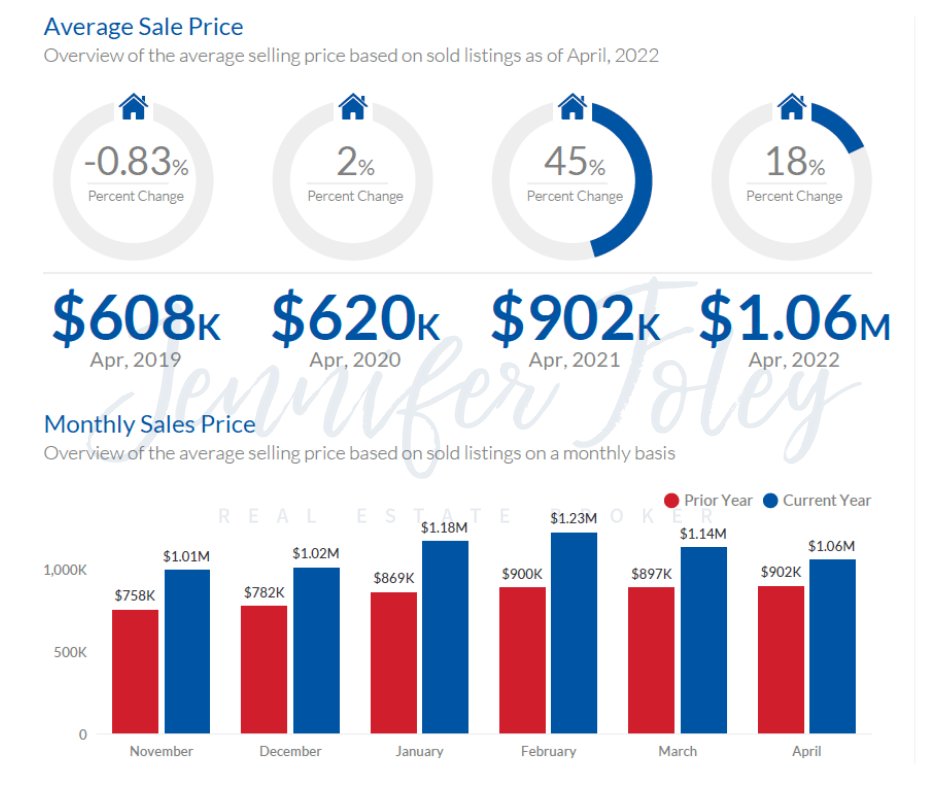
- April 2022: The average sales price was $1.06M, an 18.02% increase from April 2021
- April 2021: The average sales price was $902K, a 45.44% increase from April 2020
- April 2020: The average sales price was $620K, a 2.10% increase from April 2019
- April 2019: The average sales price was $608K, a 0.83% increase from April 2018
V. Monthly Average Days on Market
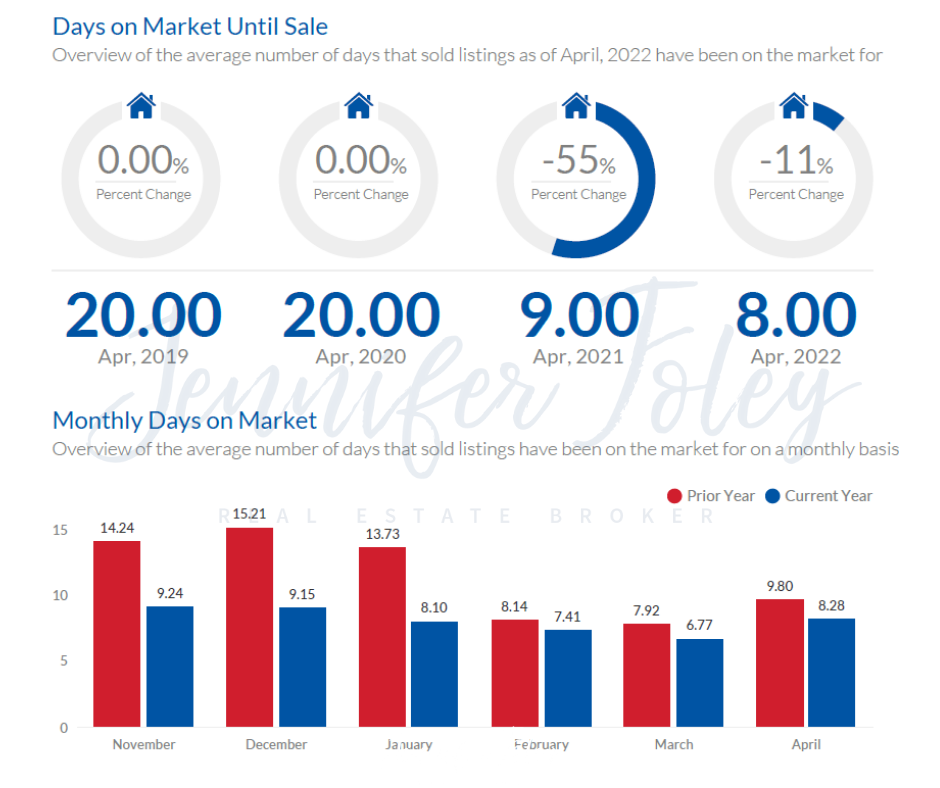
- April 2022: The average days on market was 8.00, an 11.11% decrease from April 2021
- April 2021: The average days on market was 9.00, a 55.00% decrease from April 2020
- April 2020: The average days on market was 20.00, with no increase or decrease from April 2019
- April 2019: The average days on market was 20.00, with no increase or decrease April 2018
VI. Monthly Average Ask to Sell Ratio
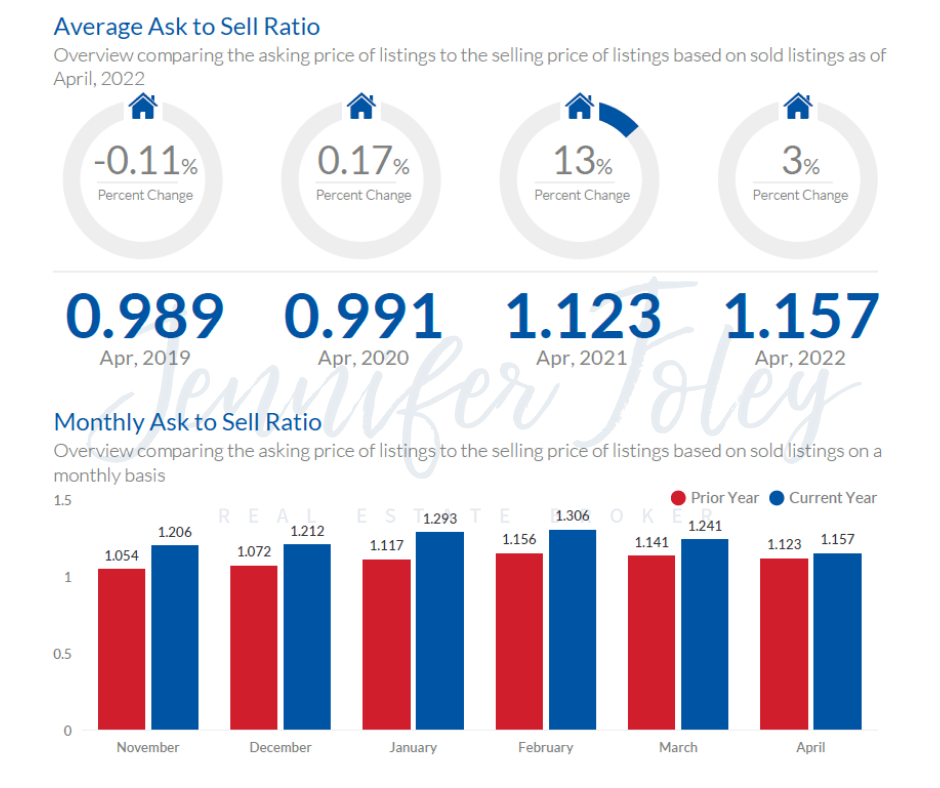
- April 2022: The average ask to sell ratio was 1.157, a 3.05% increase from April 2021
- April 2021: The average ask to sell ratio was 1.123, a 13.34% increase from April 2020
- April 2020: The average ask to sell ratio was 1.026, a 3.68% increase from April 2019
- April 2019: The average ask to sell ratio was 0.989, a 0.36% decrease from April 2018
Post a comment