.png)
Overview
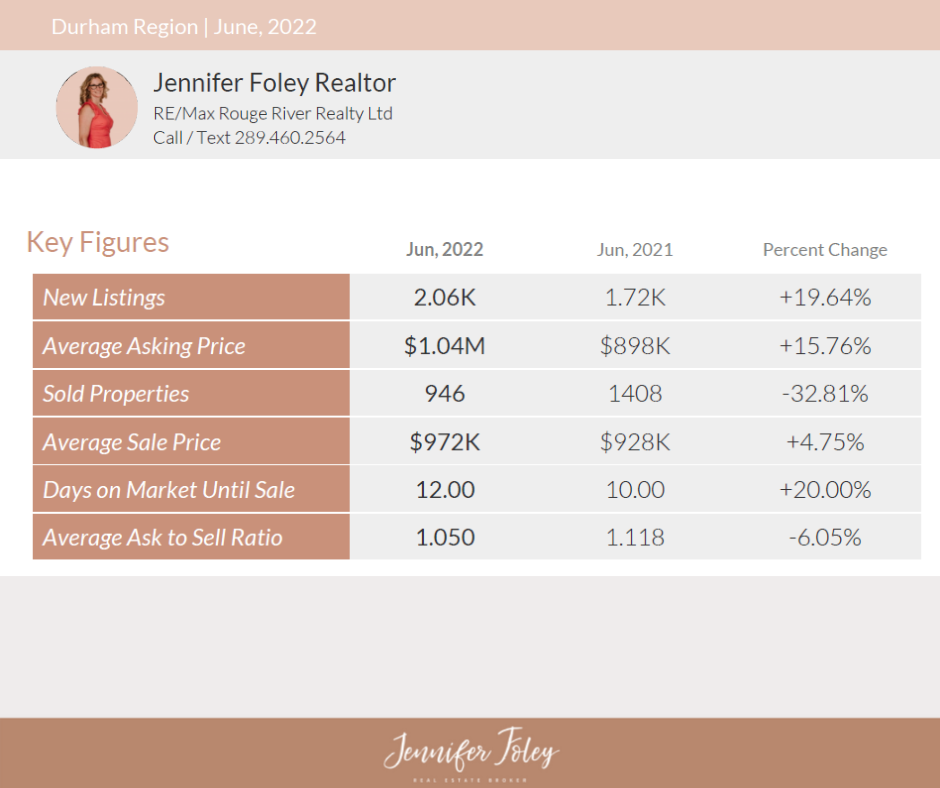
In June, 2022, we have seen 2.06K properties listed which has resulted in a 19.64% increase from June, 2021 in which 1.72K properties were listed; We have
seen a year to date volume of 12.0K in 2022 and 12.2K in 2021 resulting in a 1.98% decrease.
In June, 2022, we have seen a total volume of 946 sold properties which has resulted in a 32.81% decrease from June, 2021 in which 1408 listings were sold; We have
seen a year to date volume of 6376 in 2022 and 9125 in 2021 resulting in a 30.13% decrease.
The average sales price in June, 2022 is $972K, a 4.75% increase from June, 2021. The average sales price of June, 2021 was $928K. We have seen a year to
date average sales price of $1.10M in 2022 and $902K in 2021 resulting in a 21.89% increase.
The average ask to sell ratio in June, 2022 was 1.050, a 6.05% decrease from June, 2021 with an ask to sell ratio of 1.118. We have seen a year to date average ask to
sell ratio of 1.191 in 2022 and 1.133 in 2021 resulting in a 5.18% increase.
I. New Listings
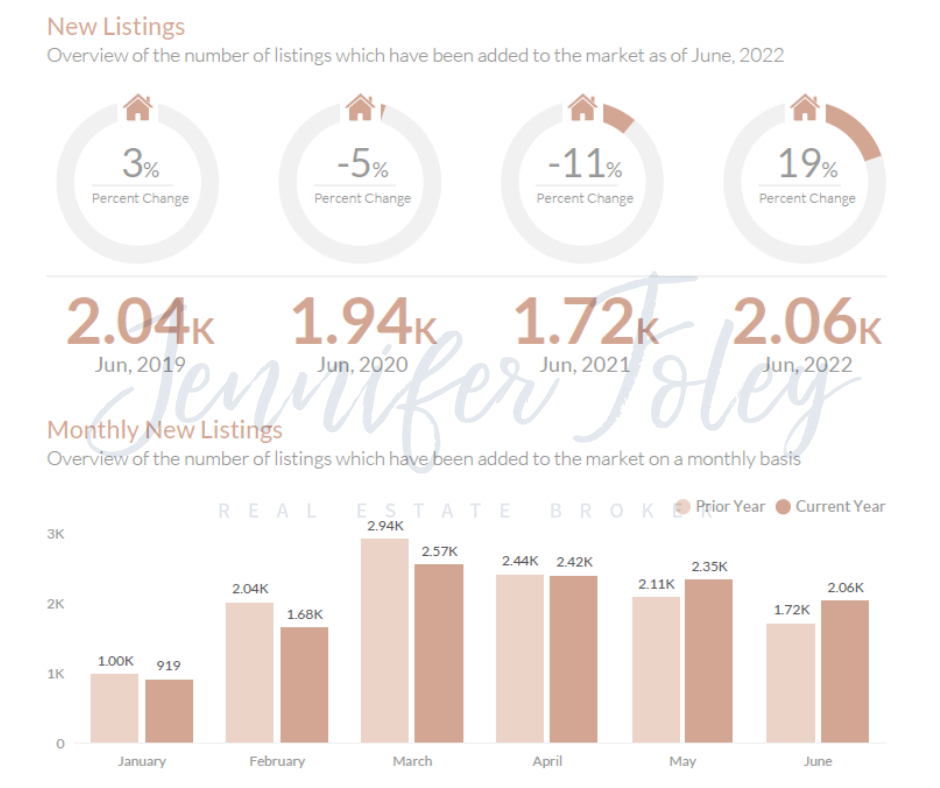
- June 2022 - There were 2.06K new listings, a 19.64% increase from June, 2021.
- June 2021 - There were 1.72K new listings, an 11.11% decrease from June, 2020.
- June 2020 - There were 1.94K new listings, a 5.14% decrease from June, 2019.
- June 2019 - There were 2.04K new listings, a 3.71% increase from June, 2018.
II. Average Asking Price
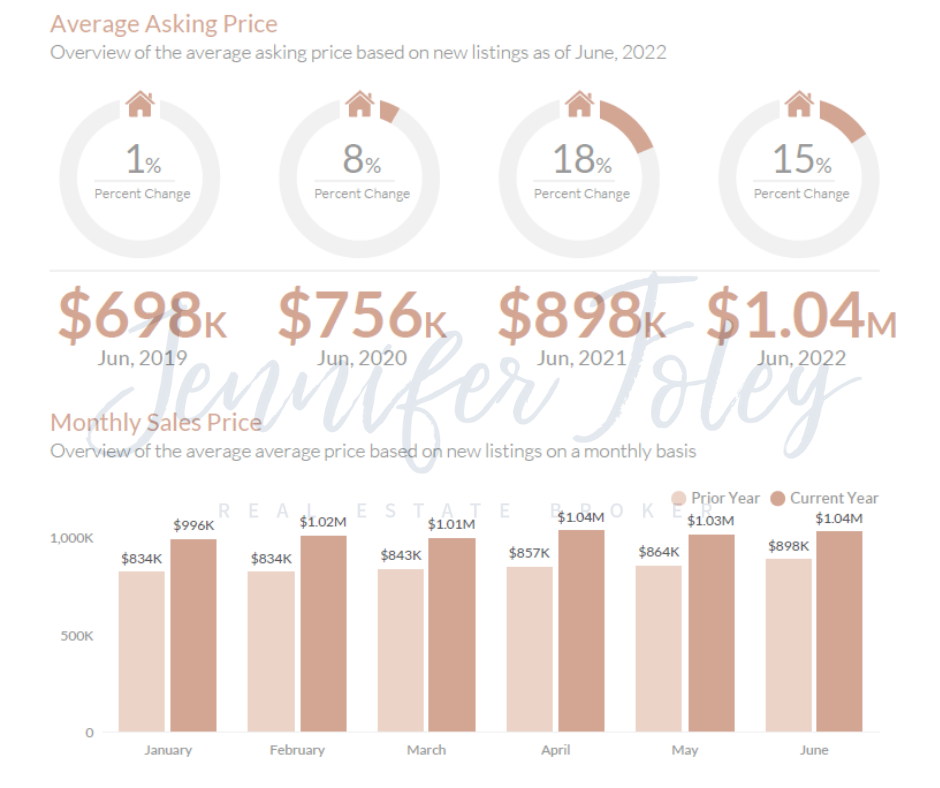
- June 2022 - The average asking price was $1.04M, a 15.76% increase from June, 2021.
- June 2021 - The average asking price was $898K, an 18.70% increase from June, 2020.
- June 2020 - The average asking price was $756K, an 8.31% increase from June, 2019.
- June 2019 - The average asking price was $698K, a 1.25% increase from June, 2018.
III. Sold Properties
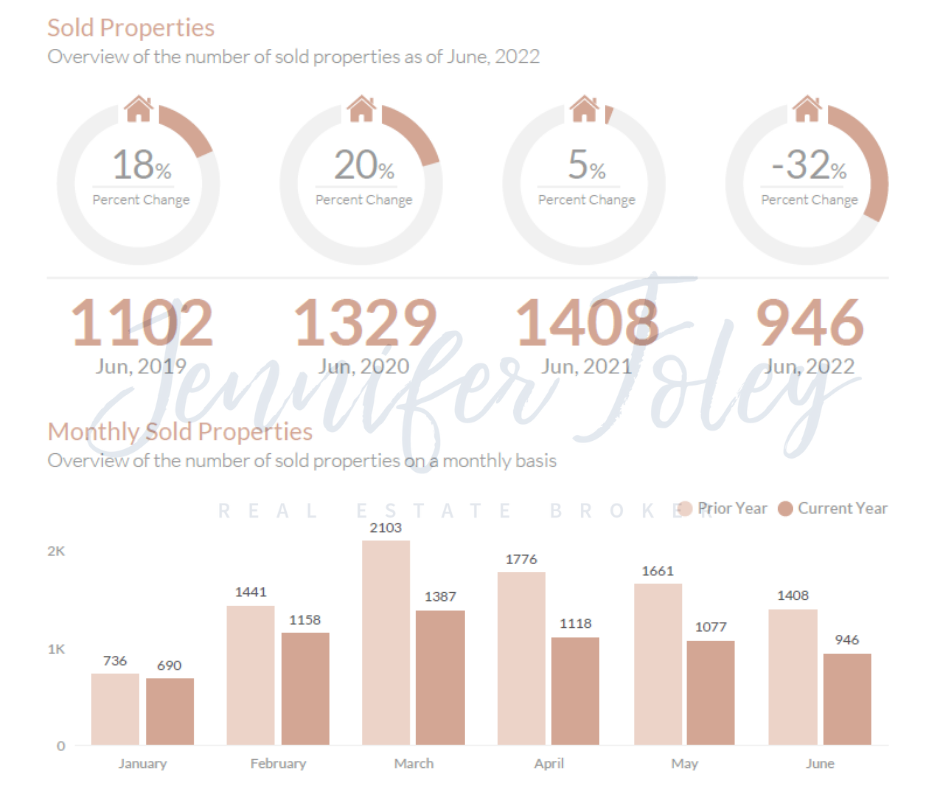
- June 2022 - There were 946 sold properties, a 32.81% decrease from June, 2021.
- June 2021 - There were 1408 sold properties, a 5.94% increase from June, 2020
- June 2020 - There were 1329 sold properties, a 20.60% increase from June, 2019
- June 2019 - There were 1102 sold properties, an 18.37% increase from June, 2018
IV. Average Sale Price
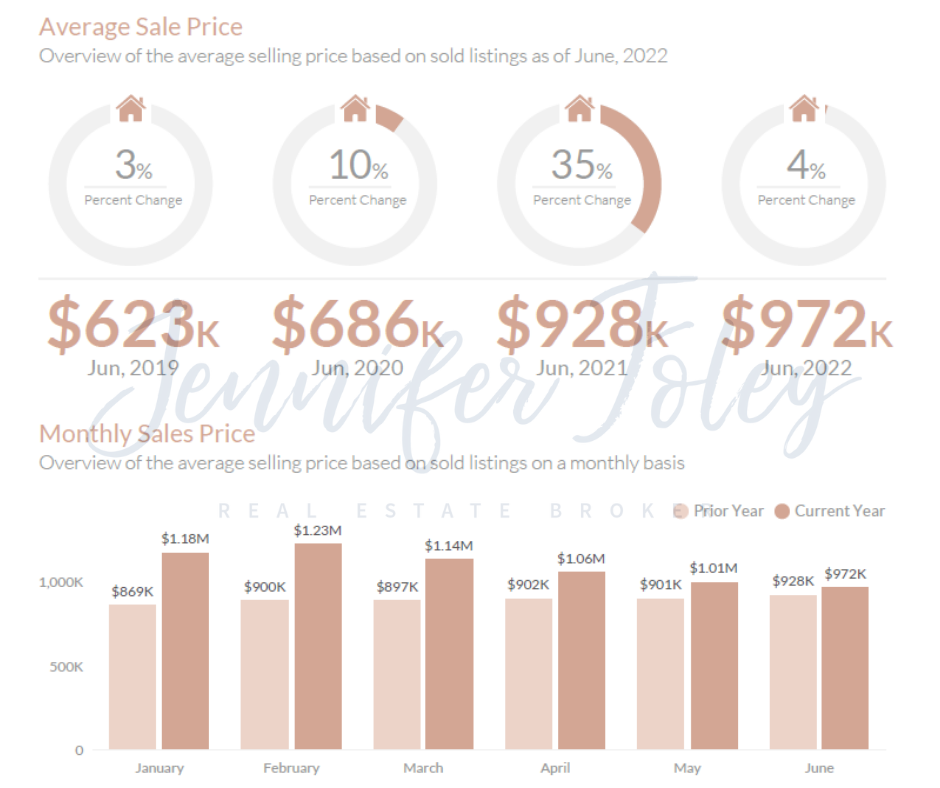
- June 2022 - The average sales price was $972K, a 4.75% increase from June, 2021.
- June 2021 - The average sales price was $928K, a 35.30% increase from June, 2020.
- June 2020 - The average sales price was $686K, a 10.17% increase from June, 2019.
- June 2019 - The average sales price was $623K, a 3.35% increase from June, 2018.
V. Average Days on Market
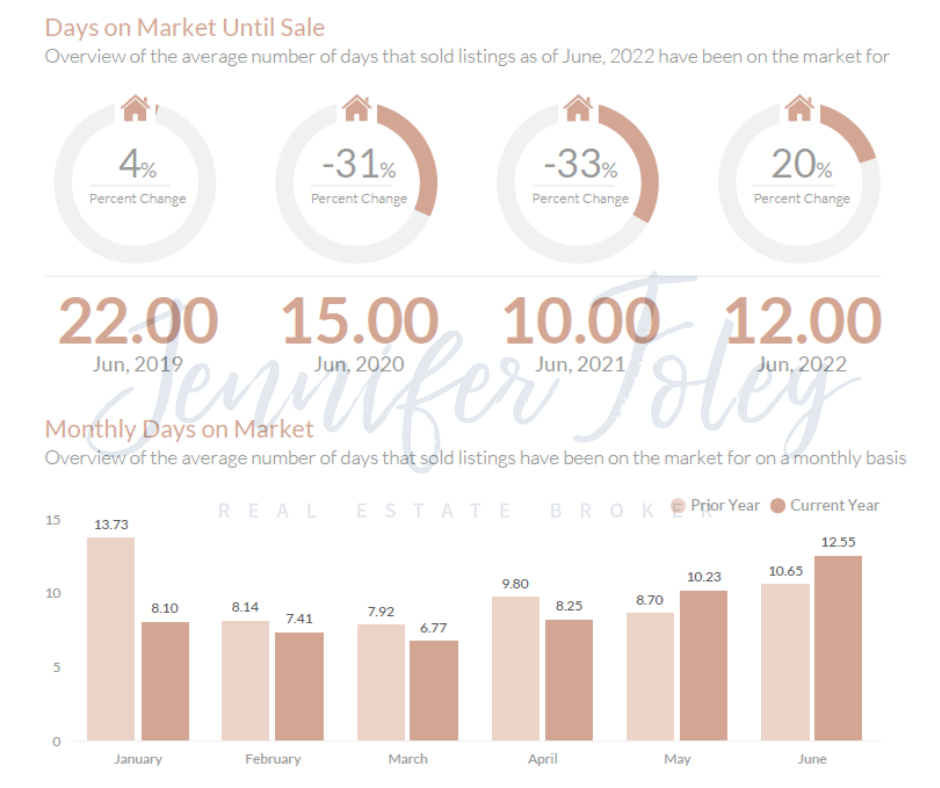
- June 2022 - The average days on market was 12.00, a 20.00% increase from June, 2021.
- June 2021 - The average days on market was 10.00, a 33.33% decrease from June, 2020.
- June 2020 - The average days on market was 15.00, a 31.82% decrease from June, 2019.
- June 2019 - The average days on market was 22.00, a 4.76% increase from June, 2018.
VI. Average Ask to Sell Ratio
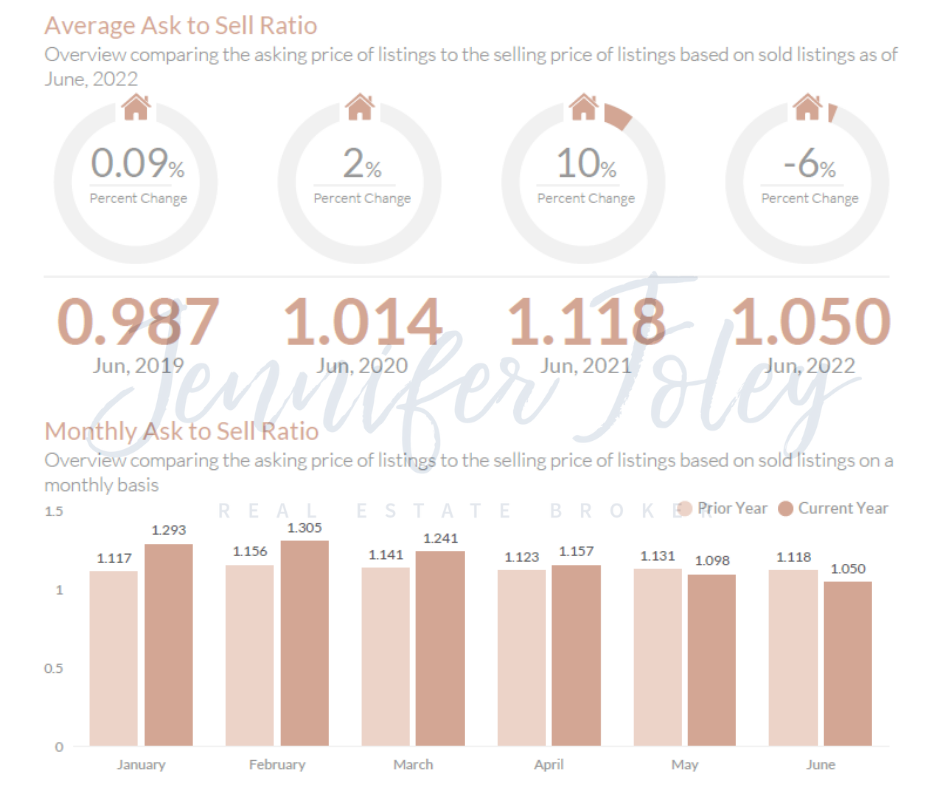
- June 2022 - The average ask to sell ratio was 1.050, a 6.05% decrease from June, 2021
- June 2021 - The average ask to sell ratio was 1.118, a 10.27% increase from June, 2020
- June 2020 - The average ask to sell ratio was 1.014, a 2.73% increase from June, 2019
- June 2019 - The average ask to sell ratio was 0.987, a 0.09% increase from June, 2018
Post a comment