
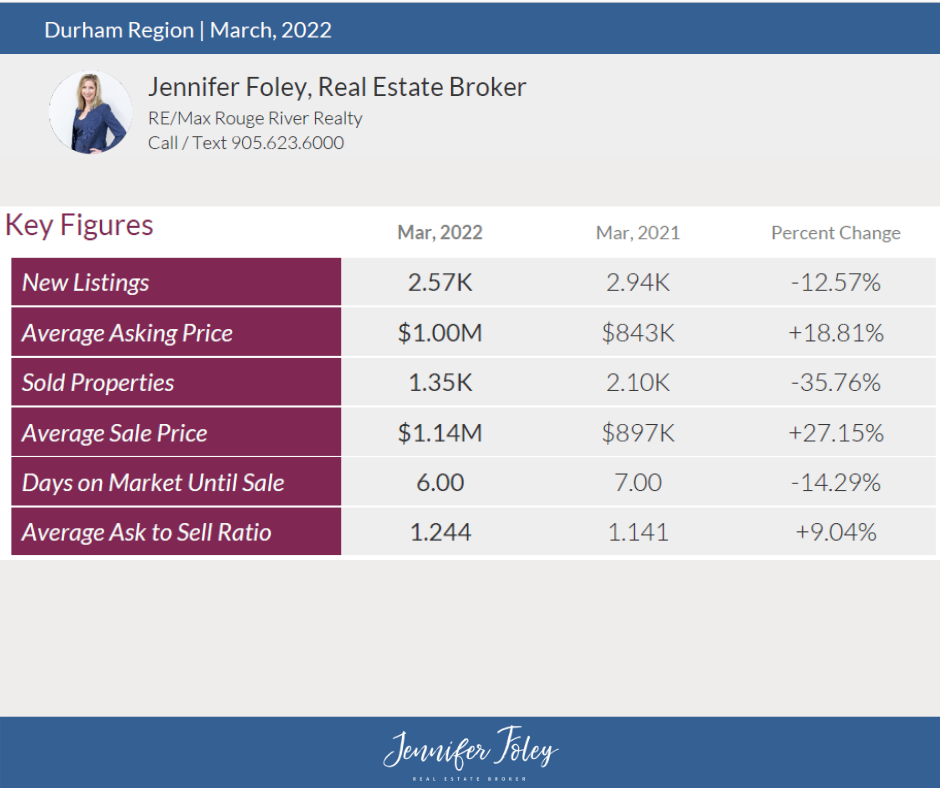
March 2022 Durham Region Monthly Housing Update
In March 2022, we have seen 2.57K properties listed which have resulted in a 12.57% decrease from March 2021 in which 2.94K properties were listed;
We have seen a year-to-date volume of 5.16K in 2022 and 5.98K in 2021 resulting in a 13.61% decrease.
I. Monthly New Listing
- March - 2022: There were 2.57K new listings, a 12.57% decrease from March 2021
- March - 2021: There were 2.94K new listings, a 53.88% increase from March 2020
- March - 2020: There were 1.91K new listings, a 13.64% increase from March 2019
- March - 2019: There were 1.68K new listings, a 7.75% decrease from March 2018
II. Monthly Average Asking Price

- March - 2022: The average asking price was $1.00M, an 18.81% increase from March 2021
- March - 2021: The average asking price was $843K, an 18.83% increase from March 2020
- March - 2020: The average asking price was $710K, a 4.72% increase from March 2019
- March - 2019: The average asking price was $678K, a 2.43% decrease from March 2018
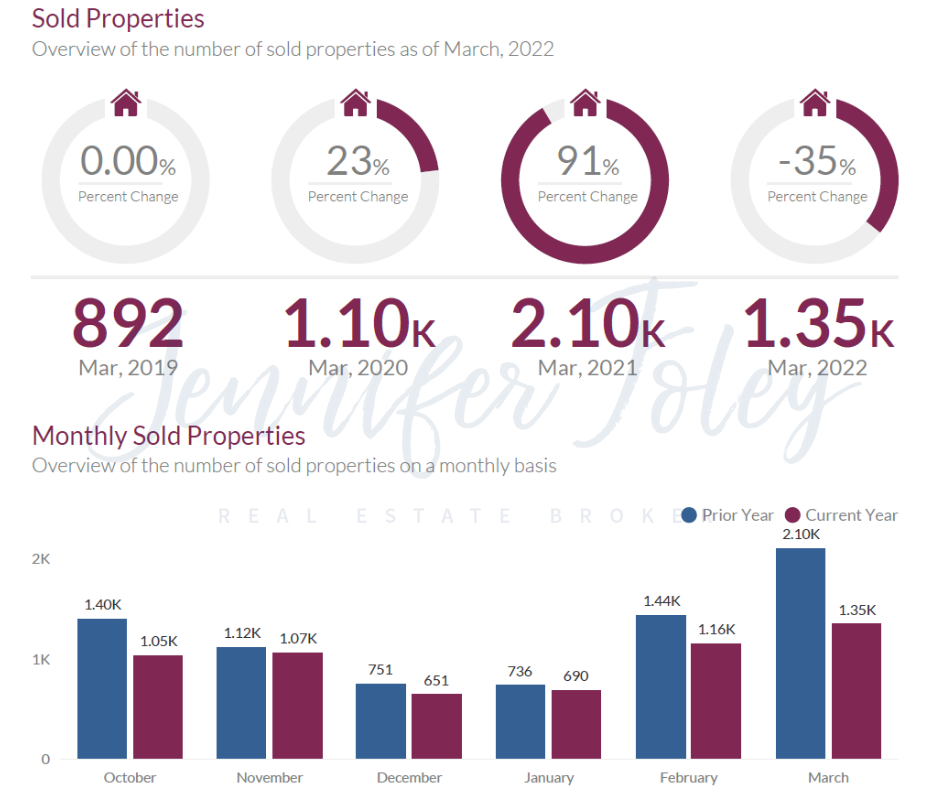
III. Monthly Sold Properties
- March 2022: There were 1.35K sold properties, a 35.76% decrease from March 2021
- March 2021: There were 2.10K sold properties, a 91.53% increase from March 2020
- March 2020: There were 1.10K sold properties, a 23.09% increase from March 2019
- March 2019: There were 892 sold properties, no increase or decrease from March 2018
IV. Monthly Average Sale Price
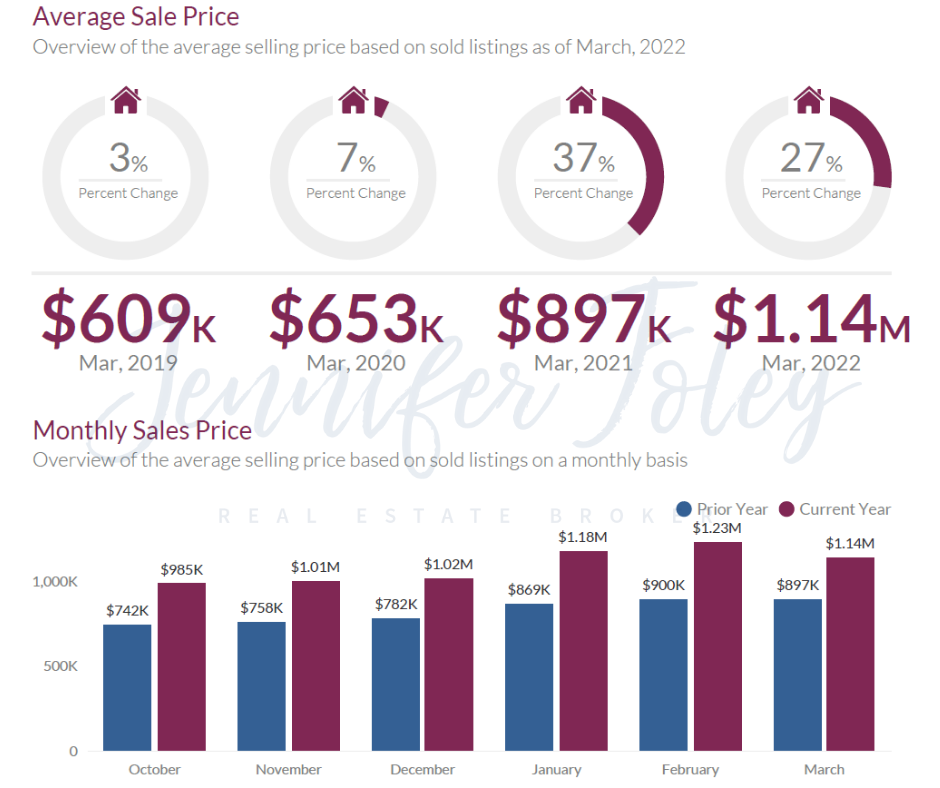
- March 2022: The average sales price was $1.14M, a 27.15% increase from March 2021
- March 2021: The average sales price was $897K, a 37.45% increase from March, 2020
- March 2020: The average sales price was $653K, a 7.13% increase from March 2019
- March 2019: The average sales price was $609K, a 3.03% increase from March 2018
V. Monthly Average Days on Market
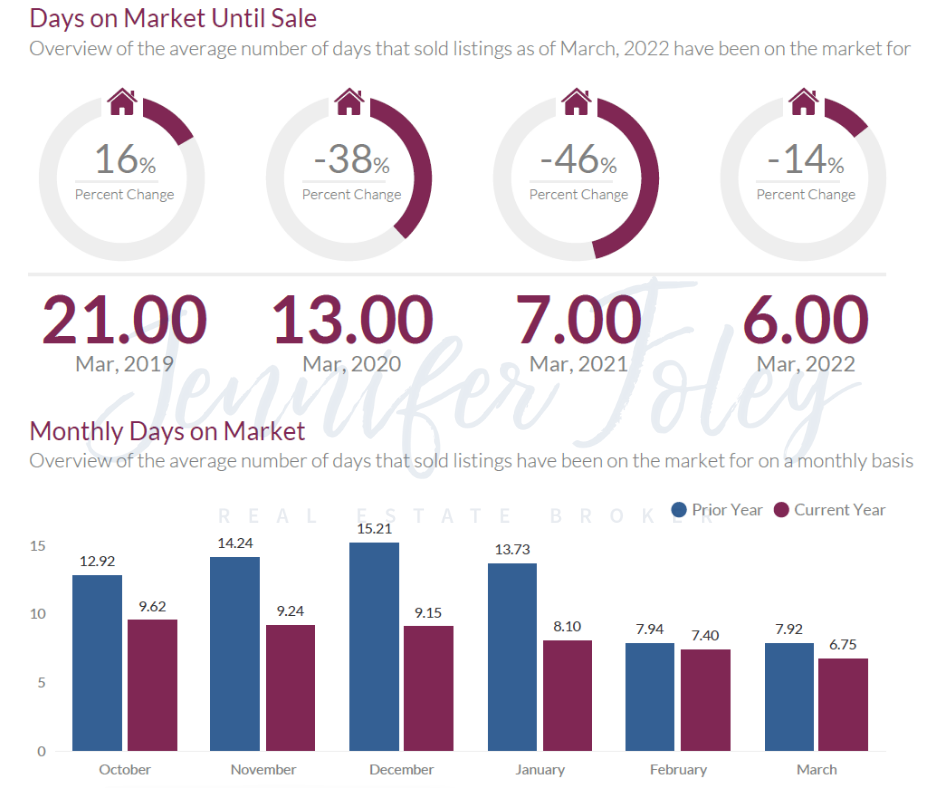
- March 2022: The average days on market was 7.00, a 12.50% decrease from March 2021
- March 2021: The average days on market was 8.00, a 55.56% decrease from March 2020
- March 2020: The average days on market was 18.00, a 25.00% decrease from March 2019
- March 2019: The average days on market was 24.00, a 9.09% increase from March, 2018
VI. Monthly Average Ask to Sell Ratio
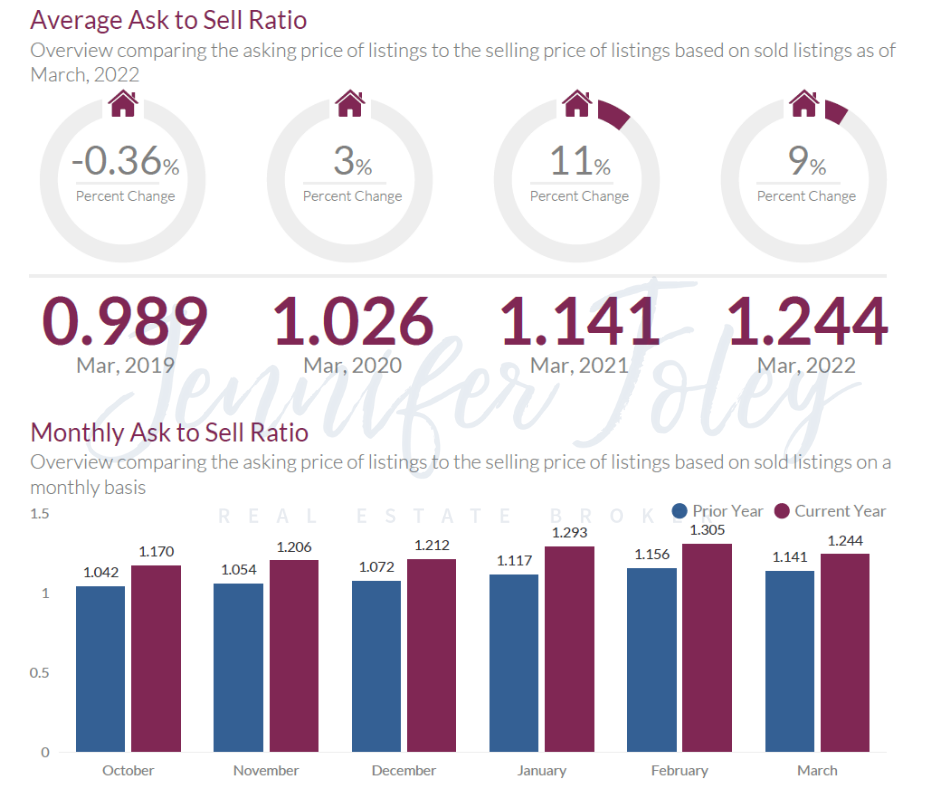
- March 2022: The average ask to sell ratio was 1.244, a 9.04% increase from March 2021
- March 2021: The average ask to sell ratio was 1.141, an 11.24% increase from March 2020
- March 2020: The average ask to sell ratio was 1.026, a 3.68% increase from March 2019
- March 2019: The average ask to sell ratio was 0.989, a 0.36% decrease from March, 2018
Post a comment