
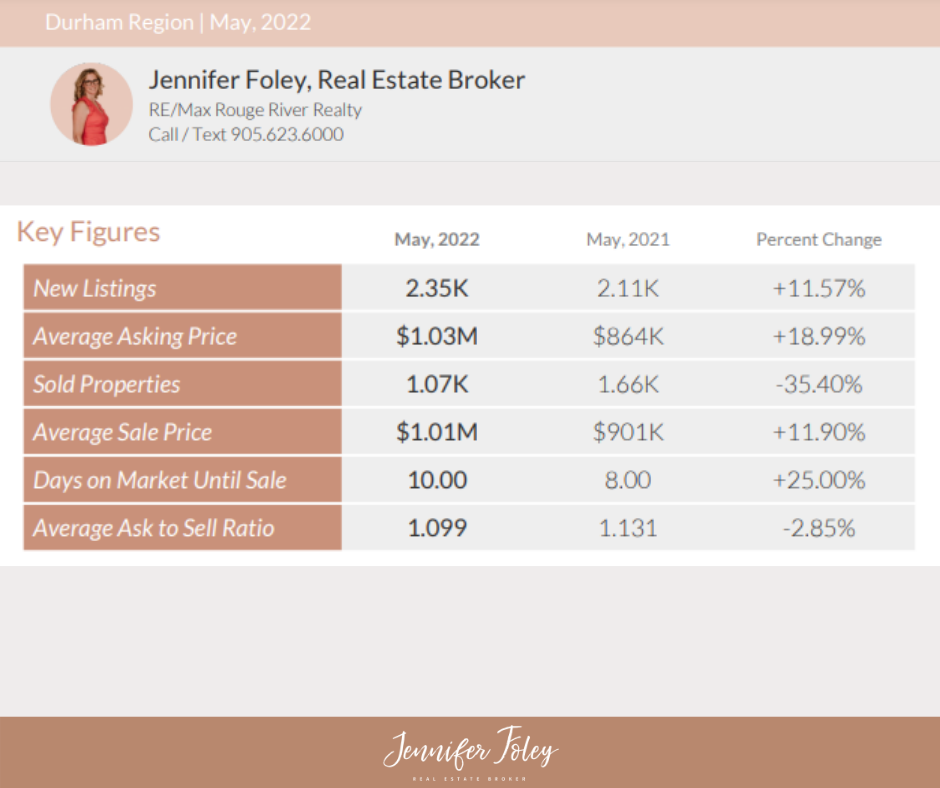
In May, 2022, we have seen 2.35K properties listed which has resulted in an 11.57% increase from May, 2021 in which 2.11K properties were listed;
We have seen a year to date volume of 9.94K in 2022 and 10.5K in 2021 resulting in a 5.51% decrease.
In May, 2022, we have seen a total volume of 1.05K sold properties which has resulted in a 36.60% decrease from May, 2021 in which 1.66K listings were sold;
We have seen a year to date volume of 5.42K in 2022 and 7.72K in 2021 resulting in a 29.83% decrease
The average sales price in May, 2022 is $1.01M, an 11.79% increase from May, 2021. The average sales price of May, 2021 was $901K.
We have seen a year to date average sales price of $1.12M in 2022 and $897K in 2021 resulting in a 25.08% increase.
The average ask to sell ratio in May, 2022 was 1.099, a 2.79% decrease from May, 2021 with an ask to sell ratio of 1.131.
We have seen a year to date average ask to sell ratio of 1.217 in 2022 and 1.135 in 2021 resulting in a 7.16% increase.
I. Monthly New Listing
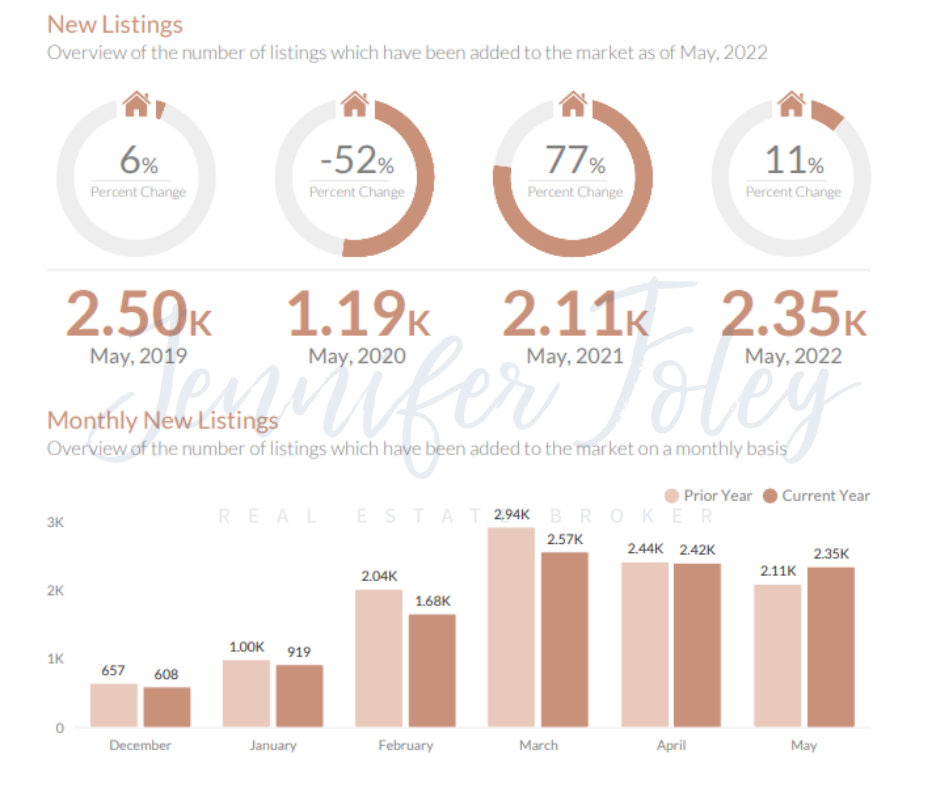
- May 2022: There were 2.35K new listings, an 11.57% increase from May, 2021
- May 2021: There were 2.11K new listings, a 77.44% increase from May, 2020
- May 2020: There were 1.19K new listings, a 52.48% decrease from May, 2019
- May 2019: There were 2.50K new listings, a 6.07% increase from May, 2018
II. Monthly Average Asking Price

- May 2022: The average asking price was $1.03M, an 18.89% increase from May, 2021
- May 2021: The average asking price was $864K, a 9.51% increase from May, 2020
- May 2020: The average asking price was $789K, a 12.12% increase from May, 2019
- May 2019: The average asking price was $704K, a 2.37% increase from May, 2018
III. Monthly Sold Properties
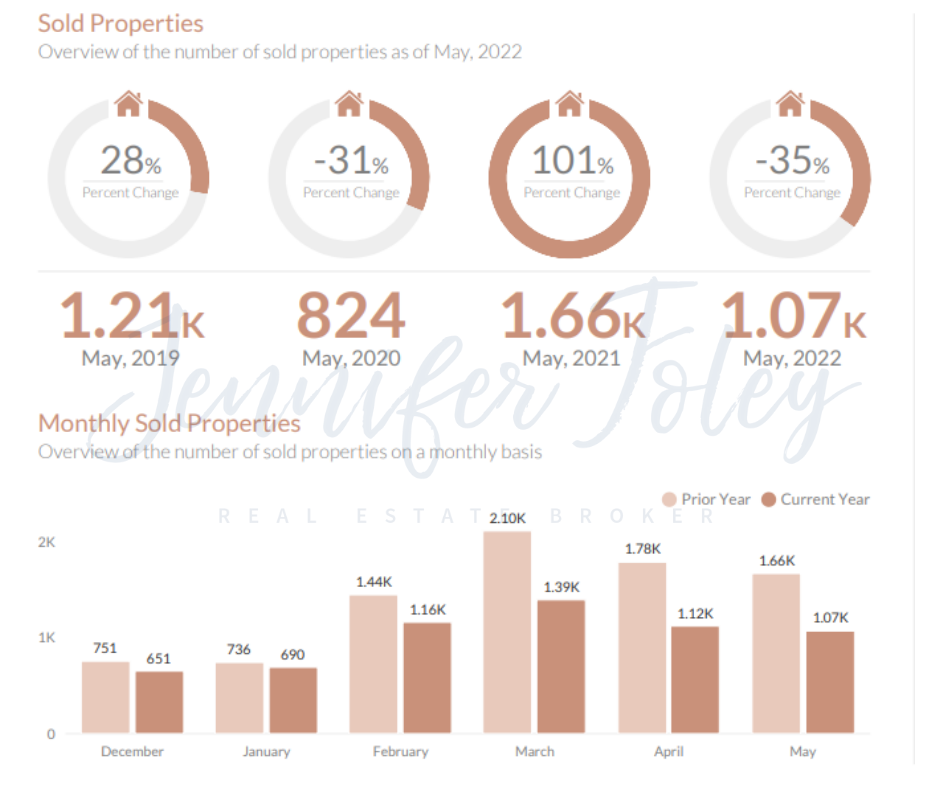
- May 2022: There were 1.05K sold properties, a 36.60% decrease from May, 2021
- May 2021: There were 1.66K sold properties, a 101.58% increase from May, 2020
- May 2020: There were 824 sold properties, a 31.67% decrease from May, 2019.
- May 2019: There were 1.21K sold properties, a 28.16% increase from May, 2018
IV. Monthly Average Sale Price
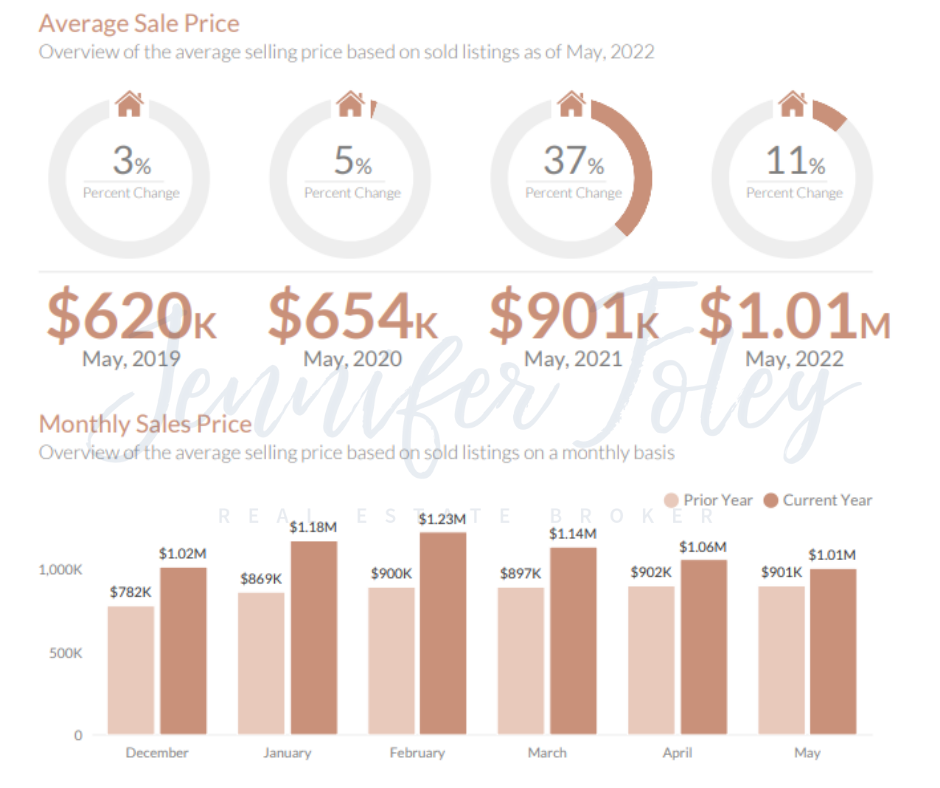
- May 2022: The average sales price was $1.01M, an 11.79% increase from May, 2021
- May 2021: The average sales price was $901K, a 37.90% increase from May, 2020
- May 2020: The average sales price was $654K, a 5.41% increase from May, 2019
- May 2019: The average sales price was $620K, a 3.61% increase from May, 2018
V. Monthly Average Days on Market
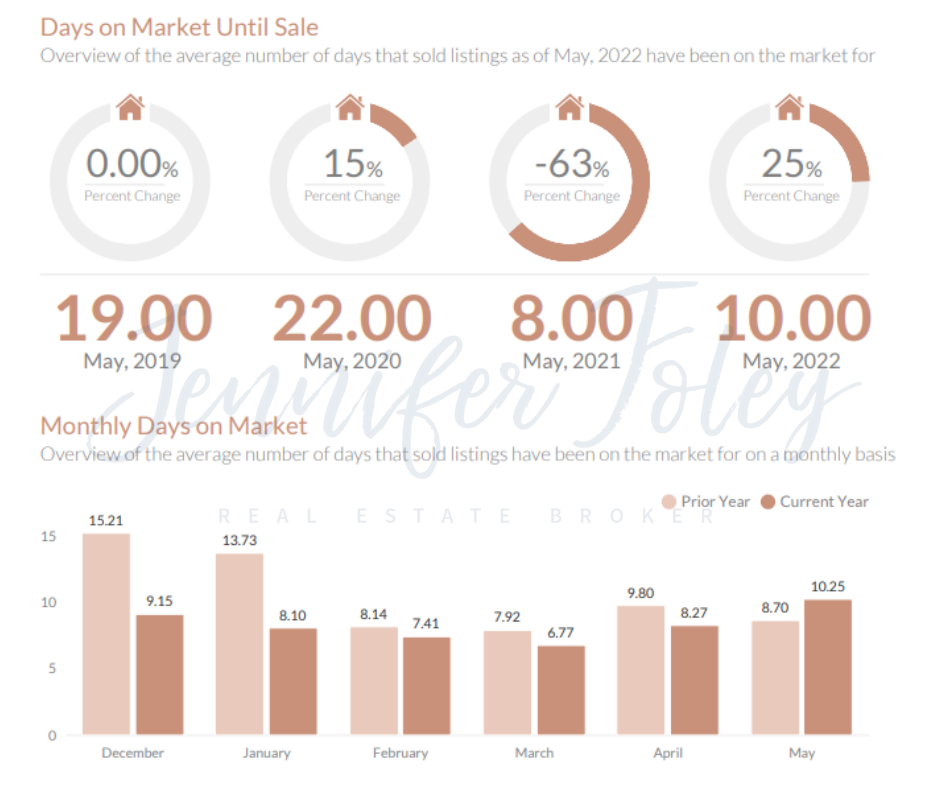
- May 2022: The average days on market was 10.00, a 25.00% increase from May, 2021
- May 2021: The average days on market was 8.00, a 63.64% decrease from May, 2020
- May 2020: The average days on market was 22.00, a 15.79% increase from May, 2019
- May 2019: The average days on market was 19.00, no increase or decrease from May, 2018
VI. Monthly Average Ask to Sell Ratio
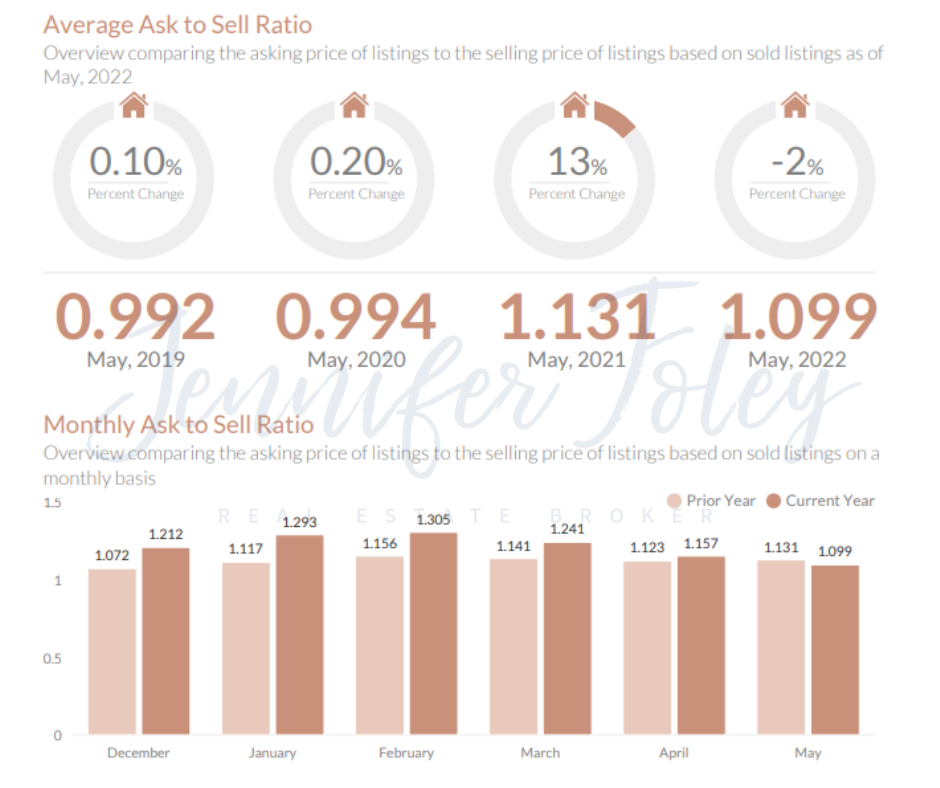
- May 2022: The average ask to sell ratio was 1.099, a 2.79% decrease from May, 2021
- May 2021: The average ask to sell ratio was 1.131, a 13.77% increase from May, 2020
- May 2020: The average ask to sell ratio was 0.994, a 0.20% increase from May, 2019
- May 2019: The average ask to sell ratio was 0.992, a 0.10% increase from May, 2018
Post a comment